

Transforming your content using infographics
The average adult spends more than eight hours a day consuming media. Television, internet, radio, print and even outdoor advertising. And that number will continue to grow, bolstered by growth in digital media.
With all of that information overload, how are smart organizations cutting through the clutter? With attractive, easy-to-digest infographics, of course!
Why does this work? Well, the brain is mainly an image processor; it absorbs visual information 60,000 times faster than information displayed in text. We also know that visual cues help us better remember information – people recall 10 percent of what they hear, 20 percent of what they read and 80 percent of what they see and do.
But not just any infographic will do. A recent study shows that well-designed content is:
- Easier to read
- More interesting
- More enjoyable
- Helps readers learn about the topic
- Makes readers want to find out more about the topic
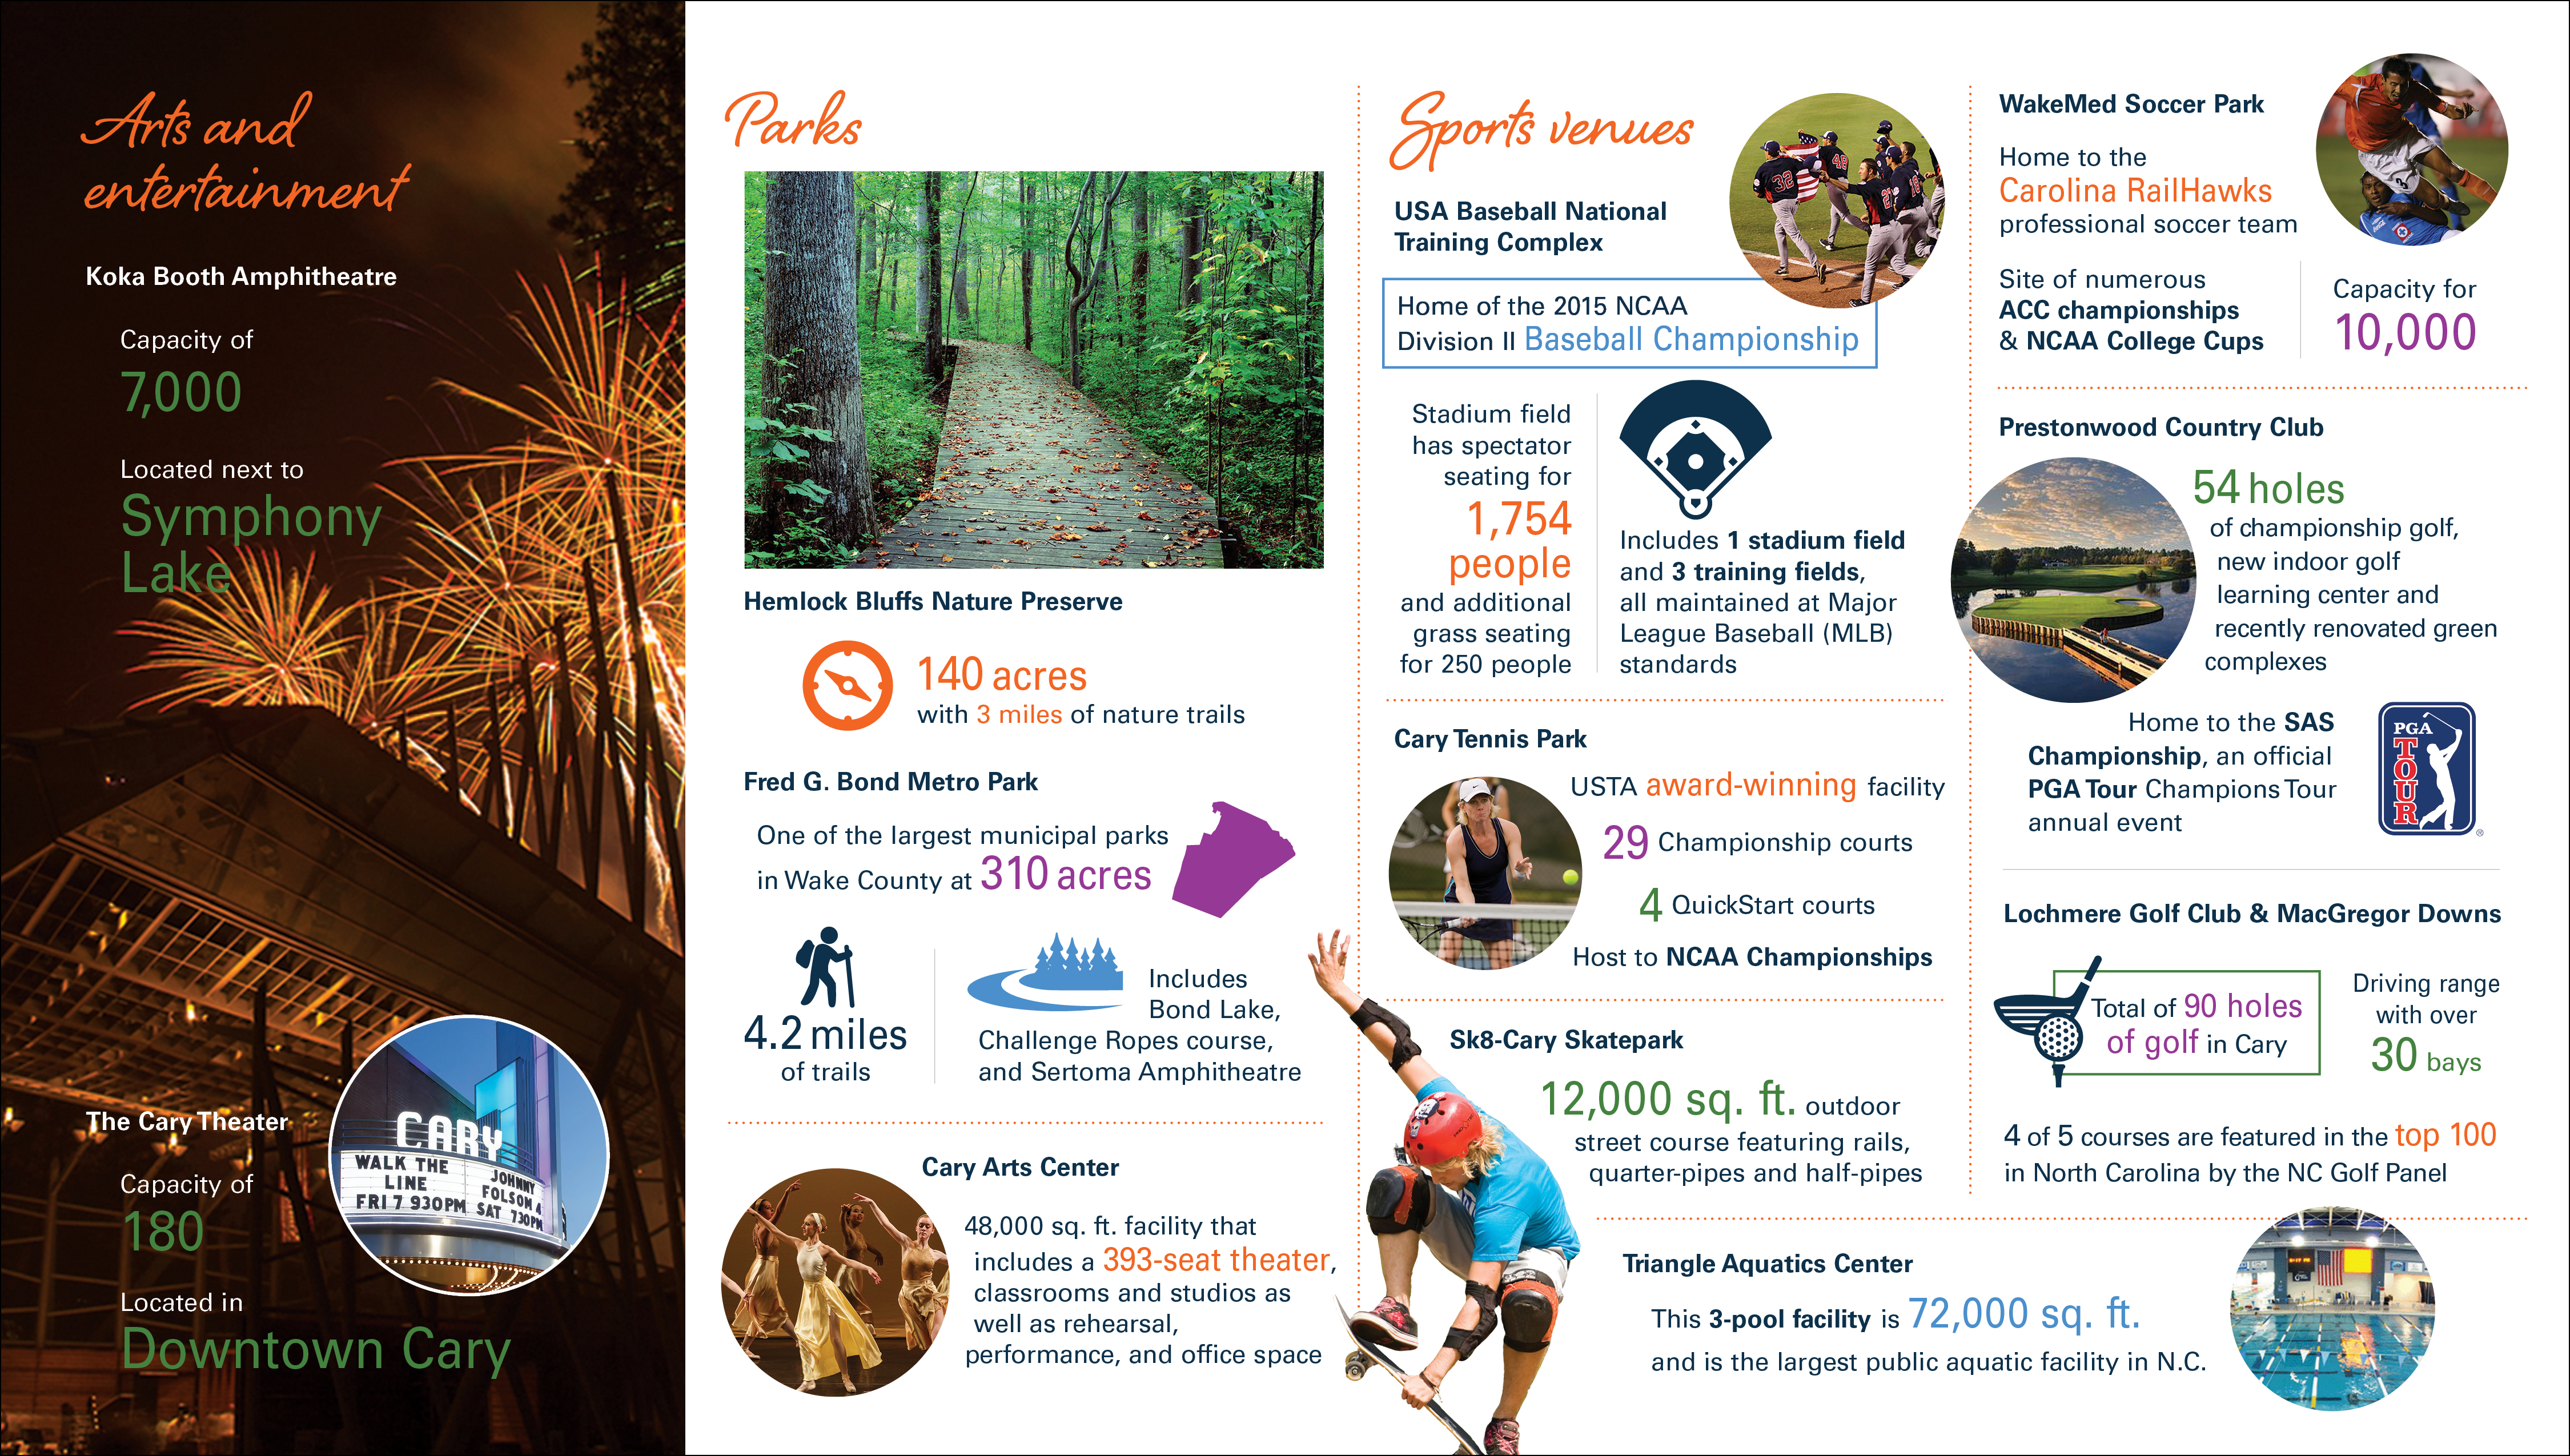
For example, we created this piece for Cary Economic Development highlighting the town’s best attractions. Before we transformed it, the content was just a bulleted list. Using color, graphics, photos and typography, we re-organized a sizable chunk of information into an infographic that is more appealing and memorable to readers.
Infographics are persuasive, accessible, engaging and easy to share. Let us help you build an effective infographic for your most important content!
Check out some of the best infographics of 2015 (so far).